Share
Take Your DAM Data to New Heights With PhotoShelter Analytics
Powerful insights, clear reports. PhotoShelter’s analytics give you the tools to elevate your entire marketing strategy.
Introducing our all-new, in-platform PhotoShelter Analytics reporting dashboard. This intuitive reporting tool is designed to provide Admins and Editors with valuable asset insights and key account activity data, beyond what’s available in the Download Log.
Calculating the ROI of your brand assets has never been easier with these six visually appealing reports.
PhotoShelter Analytics now allows creative team leads the ability to:
- Access easy-to-understand visual reports and gain valuable insights to make more informed content marketing and content production decisions
- Maximize the value of their brand’s visual assets
- Showcase the impact of the entire creative team’s work and demonstrate ROI with confidence
- Understand what stakeholders are often searching for to fill content gaps or adjust organization-wide keyword tagging structures
- Answer their team’s most pressing questions about what content works and why
Our team is solely focused on making PhotoShelter the fastest, easiest, smartest DAM solution, and today’s new feature release takes another big leap forward to achieve that vision. The PhotoShelter Analytics dashboard contains six individual reports for Library Admins and Editors to see specific asset usage in the Library, Portal and Workspaces, at a glance.
Access Asset Insights Instantly with PhotoShelter Analytics
1) Daily Uploads
The Daily Uploads line chart shows the total daily assets uploaded to your PhotoShelter account, allowing you to assess the productivity of your extended account user base. Plus, you can correlate upload activity with coinciding marketing tactics or programs like live events, an annual report, or a brand campaign.
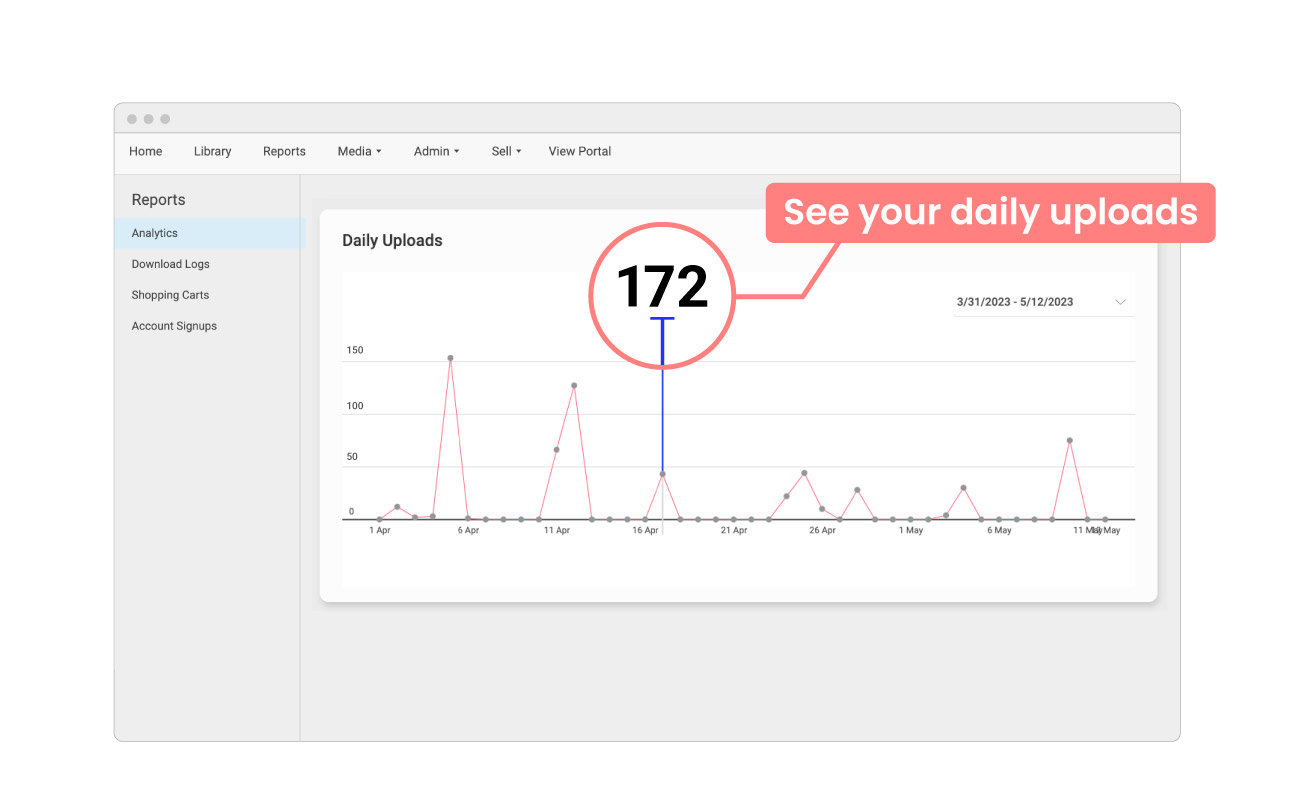 In the top navigation of your library, click on ‘reports’ to display the first of six new visual data reports available to you in Photoshelter Analytics. this graphic shows the daily uploads report and how to view upload activity for a specific day by selecting a dot on the chart.
2) Daily Downloads
This Daily Downloads chart shows exactly how many assets are being downloaded from your digital asset management (DAM) Library, Portal, and Workspaces combined. This report allows you to quantify the download activity of your organizational and external partners. Plus, you can quickly correlate download activity to the timing of specific marketing tactics and programs like pre- and post-event promotion or a new partnership marketing campaign.
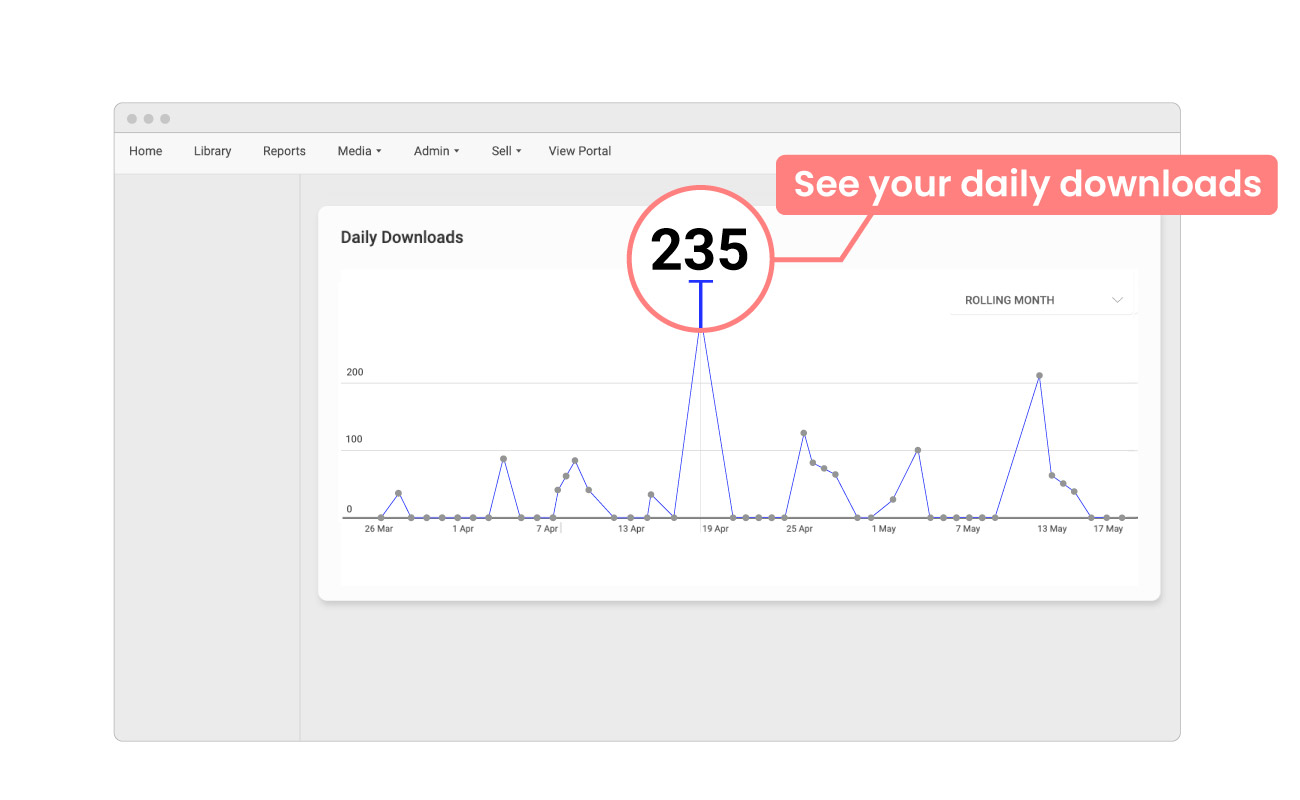 This graphic shows the daily downloads report and how to view upload activity for a specific day by selecting a dot on the chart.
3) Most Popular Images Downloaded
The Most Popular Images Downloaded report provides a ranked list of the top three most-downloaded images from all the assets within your Library, Portal, and Workspaces. Consistently assessing what content is downloaded using the Most Popular Images Downloaded report in PhotoShelter Analytics will help you see what visuals resonate with your internal and external audiences. Want a comprehensive list of the most popular assets downloaded from your DAM? You can download a .CSV file of the Top 100 Most Popular Images Downloaded within the past month, 3 months, or year.
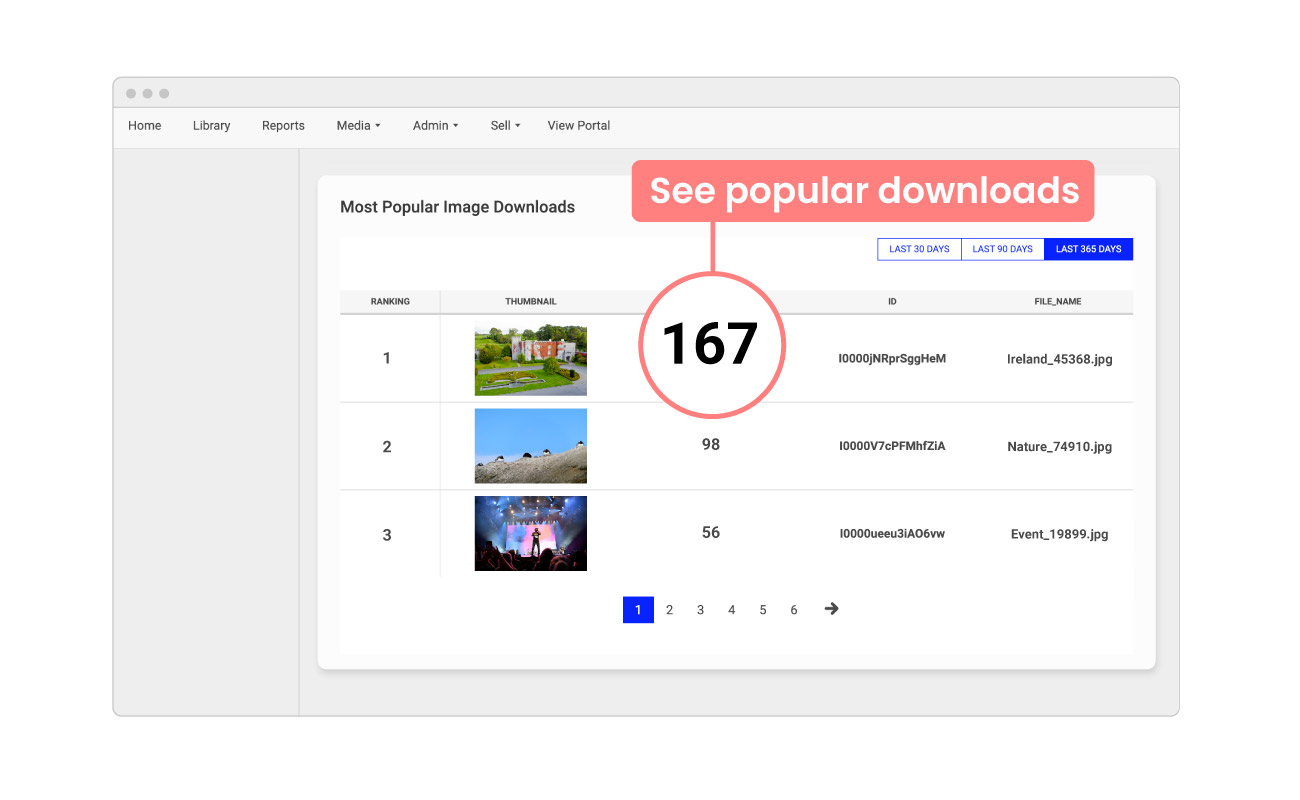 The most popular images downloaded report displays a thumbnail of each image, how many times each asset was downloaded, the asset id, and the file name to help you trace assets back to your Photoshelter library with ease.
4) Top 5 Search Terms
The Top 5 Search Terms report shows a ranked list of the keywords your PhotoShelter users are collectively searching for within your Library, Portal, and Workspaces for the past month, three months, or year. If your brand’s keyword list looks drastically different than these Top 5 Search Terms, it’s time to meet your users where they are and update your metadata policy to incorporate these.
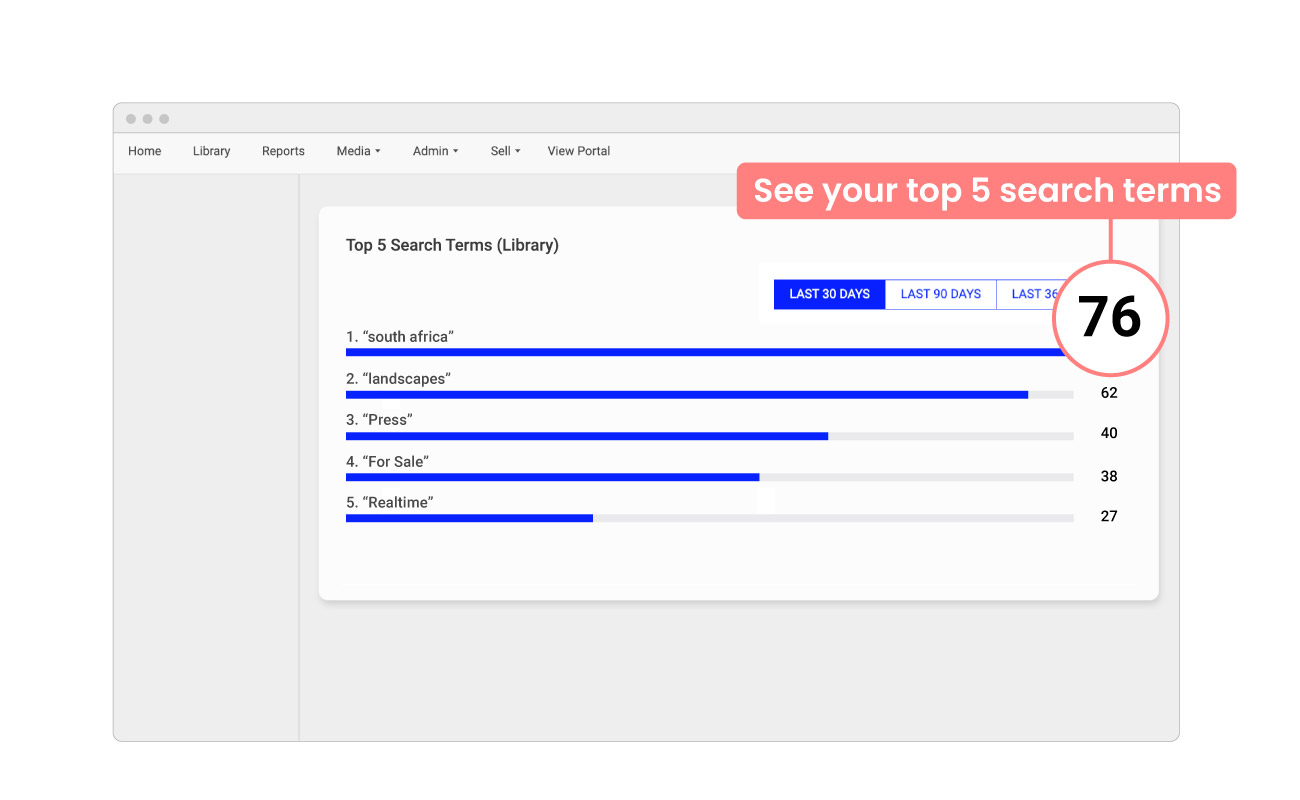
In addition to a ranked list of the most popular keywords searched by your Photoshelter account users, the Top 5 search terms report also shows the amount of times each keyword was searched.
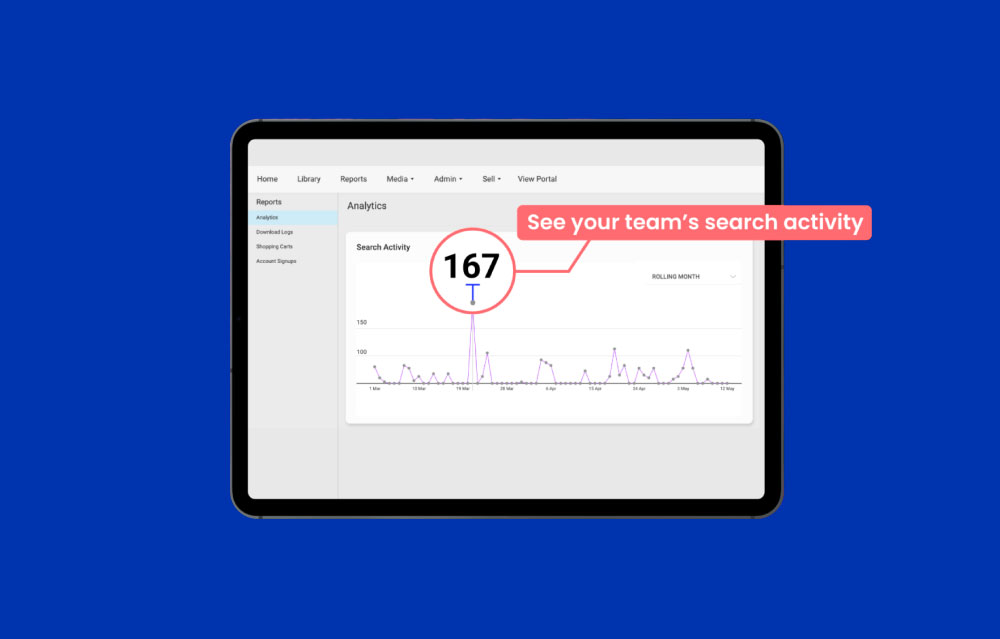
5.) Search Activity
The Search Activity report shows the number of searches made across your Library, Portal, and Workspaces. This data helps you demonstrate the value of your DAM by showing how often users search for content. When combined with the Top 5 Search Terms report, you can see which content is most popular with all users, not just those who download or upload files.
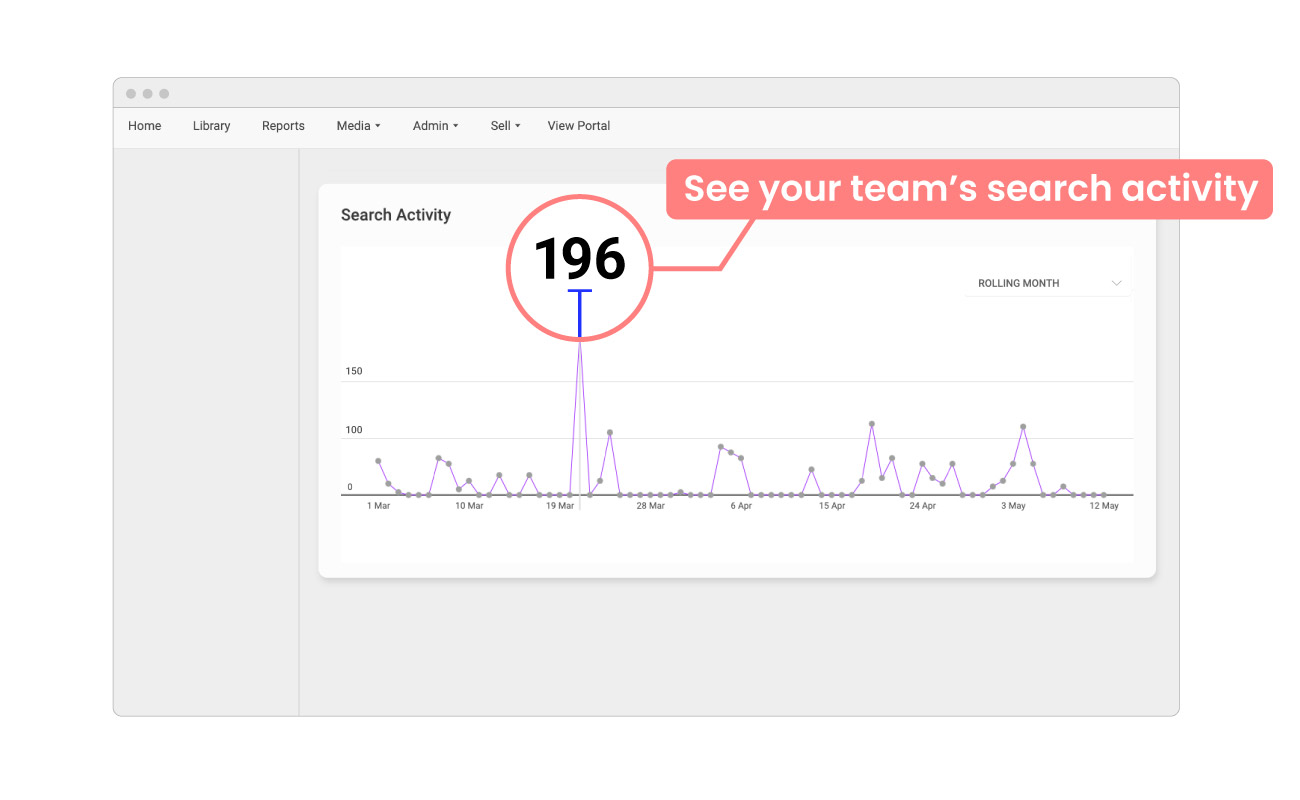
The search activity report shows exactly how many searches are being conducted within your Photoshelter account.
6) Downloads by File Type
Seeing downloads by file type helps you understand which content formats are most in demand. This insight allows you to allocate resources effectively, prioritize the creation of popular file types, and identify gaps in your content library. It ensures you’re meeting user needs and making strategic decisions to enhance your content offerings.
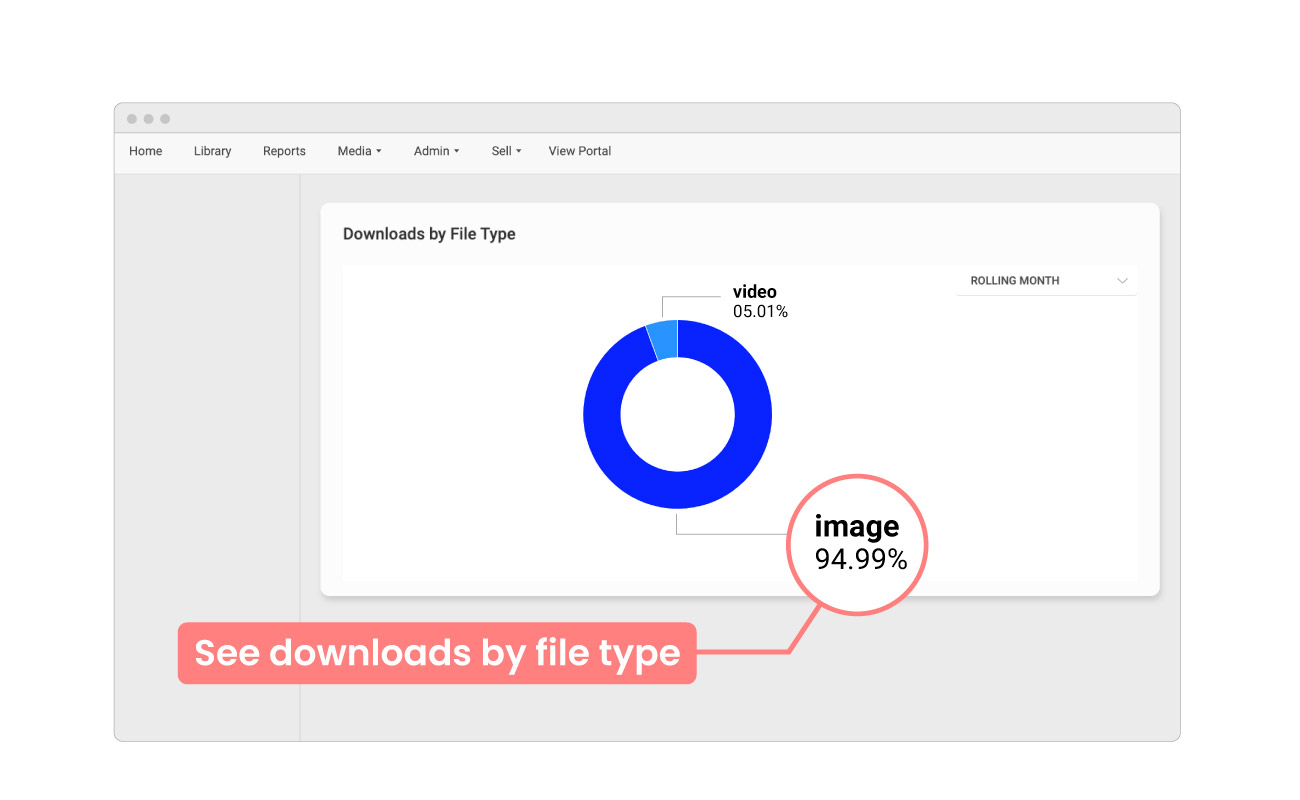
The Downloads by File Type donut chart displays a breakdown of what lives in your dam library as a visual ratio.
What our customers are saying about PhotoShelter Analytics
Whenever we launch an impactful feature or platform enhancement with our world-class brand community in mind, we love to hear feedback about how the new tool or feature impacts their workflow and organization at large.
Texas A&M Agrilife
“For my bosses, [success is measured with] analytics. It’s numbers. I literally just sent those stats over 2 days ago for a meeting today. I think in the last 6 months we’ve had like 30,000 downloads, which is really good for us. We’re really happy with those numbers.”
– Assistant Director of Visuals and Multimedia, Texas A&M Agrilife
Frontiers North Adventures
“I often check which pictures are popular. Seeing download logs helps us know if partners are accessing and using the content. It’s been super helpful.”
– Marketing and Communications Coordinator, Frontiers North Adventures
FC Cincinnati
“I definitely look at our most downloaded photos every month, and what keywords people are using to search. Then, I make sure I’m tailoring those searches and adding in new keywords every time someone’s looking for something specific.”
-Coordinator of Digital Asset Management, FC Cincinnati
Empower your team with data to fuel your content strategy with PhotoShelter Analytics
We can’t wait for you to try PhotoShelter Analytics. Tell us @PhotoShelter how your DAM data is helping your team level up your content strategy.
If you have any questions, please don’t hesitate to reach out to our support team.
Ready to transform your team’s creative workflow?
You May Also Like
-

Artificial Intelligence (AI), Content Strategy
AI in Marketing: The Hidden Cost of Faster Content
We surveyed nearly 400 professionals to understand how AI is impacting modern marketing teams. Download the white paper to see what we found.
-

PhotoShelter News
Gadsden State Moves to a Modern DAM Solution with PhotoShelter
Gadsden State Community College selects PhotoShelter as its new DAM system, bringing organization and speed to its creative operations.
-
Product Updates
Store, Find, and Share Videos with PhotoShelter
Store, organize, find, clip, and share your video content with PhotoShelter’s suite of video tools and features.


